

Machine Learning Models to Know in 2023
Get familiar with machine learning model variations and the double-edged sword that makes the technology a sharp resource.
Key Takeaways
Machine learning models are powerful tools that leverage the power of algorithms to quickly and accurately process large amounts of data, enabling more accurate predictions and decisions than manual methods.
Supervised learning aims to learn a mapping function that can accurately predict the output for new inputs that it has never seen before
Unlike supervised learning, where the algorithm is provided with a labeled dataset and learns to predict outcomes based on that data, unsupervised learning operates on unlabeled data and seeks to find patterns or groupings in the data on its own.
Explore popular machine learning models including what’s under the hood at Launchable that powers data-driven test selection intelligence.
It’s hard to go anywhere without hearing about machine learning models and the latest AI news. This isn’t surprising – the amount of data available today is only growing. This data is leading to unprecedented opportunities for machine learning. With the right algorithms and tools, businesses can quickly and accurately spot patterns in data and leverage those insights to make better decisions faster. Additionally, machine learning can help automate processes by recognizing patterns and predicting outcomes. This could lead to cost savings, improved customer experiences, and other benefits.
Machine learning models are powerful tools that leverage the power of algorithms to quickly and accurately process large amounts of data, enabling more accurate predictions and decisions than manual methods. These models can be used in various applications, ranging from predicting stock prices to diagnosing medical conditions, allowing businesses to make better decisions and provide better customer services.
In this post, we’ll explore different types of machine learning models, different approaches, and how Launchable uses machine learning to power our Predictive Test Selection feature.
Supervised Learning Models
Supervised learning is a type of machine learning where the algorithm is trained on a labeled dataset, which includes input data and corresponding output or target values. Supervised learning aims to learn a mapping function that can accurately predict the output for new inputs that it has never seen before.
To do this, the algorithm is provided with a set of input features and the corresponding correct output values, and it tries to learn the relationship between the input and output data. Once the algorithm has learned this relationship, it can predict new data based on its learned patterns.
Examples of supervised learning include predicting house prices based on the features of the house, classifying images of animals based on their characteristics, and predicting the likelihood of a customer buying a product based on their demographic and purchase history. Launchable applies this data-driven approach to software testing.
Within supervised learning, there are five algorithms to know: Linear Regression, Logistic Regression, Logistic RegressionSupport Vector Machines, Decision Trees, and Naive Bayes.
Get to Know Linear Regression
Linear Regression is a type of statistical modeling technique used to predict a continuous numeric output value based on one or more input features. It is one of the simplest and most widely used regression methods.
In Linear Regression, a linear relationship is assumed between the input features and the output variable, and the goal is to find a linear function that best fits the data. A line represents this function in two-dimensional space or a hyperplane in a higher-dimensional area.
The basic idea behind Linear Regression is to find the best set of coefficients for the linear function that minimize the difference between the predicted output values and the actual output values in the training data. This process is called "training" the model.
Once the coefficients are learned, the model can be used to make predictions on new data.
Understanding Logistic Regression
Logistic Regression is a type of classification algorithm used in machine learning and statistics to predict the probability of a binary or categorical output variable based on one or more input features.
Unlike Linear Regression, which is used to predict a continuous numeric output value, Logistic Regression models the probability of a binary outcome, such as whether an email is SPAM or a patient has a disease. The algorithm estimates the likelihood of the binary outcome by fitting a logistic function to the input data.
Logistic Regression is a widely used algorithm in various fields, including healthcare, finance, and marketing, due to its simplicity and interpretability. It is a powerful tool for predicting binary outcomes and is often used as a baseline model for more complex algorithms.
Exploring Logistic RegressionSupport Vector Machines
Logistic RegressionSupport Vector Machines (SVM) are machine learning algorithms used for classification and regression tasks. In classification tasks, SVM tries to find the best boundary, called a hyperplane, that separates the data into different classes. The goal is to find the hyperplane that maximizes the margin, or the distance between the hyperplane and the closest data points in each class.
The key idea behind Support Vector Model is to transform the data into a higher-dimensional space where a linear boundary can be more easily found. This transformation is performed by a function called a kernel function, which maps the input features into a higher-dimensional space without actually computing the coordinates of the data in that space. Once the data is transformed, the SVM algorithm finds the hyperplane that maximizes the margin between the classes.
SVM is a powerful and widely used algorithm in machine learning due to its ability to handle high-dimensional data and its effectiveness in finding the optimal boundary between classes. It is commonly used in image classification, text classification, and biological classification, among other applications.
Dissecting Decision Trees
This type of model is based on a tree-like structure, where each node represents a feature or attribute of the data, and each branch represents a decision rule based on that feature. The model learns from a set of labeled training data to create the tree, where the root node represents the most important feature, and subsequent nodes represent the next most important features.
In a Decision Tree Model, the algorithm makes a sequence of decisions to classify or predict a data point based on the features of the data. The model starts at the root node, evaluates the feature at that node, and moves down the tree to the next node based on the decision rule. This process continues until the model reaches a leaf node, which represents the final classification or prediction for the data point.
The algorithm's goal is to create a tree that is as accurate as possible in predicting outcomes for new data points while being as simple as possible to interpret and understand.
Breaking Down the Naive Bayes
In simple terms, a Naive Bayes model is a machine learning algorithm used for classification tasks, such as determining whether a particular email is SPAM or not. The model is based on Bayes' theorem, which is a mathematical formula used to calculate the probability of an event based on prior knowledge of related events.
The "naive" part of the name refers to the simplifying assumption that the presence of one feature is independent of the presence of other features, even though this may not be strictly true in practice.
In a Naive Bayes model, the algorithm learns from a set of labeled training data to calculate the probability of a new data point belonging to a certain class based on the presence or absence of different features. The model then assigns the new data point to the class with the highest probability.
Unsupervised Learning Models
Unsupervised machine learning is a machine learning algorithm used to discover patterns, relationships, and structures in data without using pre-labeled training data. Unlike supervised learning, where the algorithm is provided with a labeled dataset and learns to predict outcomes based on that data, unsupervised learning operates on unlabeled data and seeks to find patterns or groupings in the data on its own.
One of the main techniques used in unsupervised learning is clustering, which involves grouping similar data points together based on their characteristics. Another technique is dimensionality reduction, which involves reducing the number of features in a dataset to make it easier to analyze.
Unsupervised learning can be helpful in exploratory data analysis, anomaly detection, and data preprocessing, among other applications. However, it can be more challenging to evaluate the performance of an unsupervised learning algorithm compared to a supervised learning algorithm since there are no predefined labels to compare the predictions against.
To understand unsupervised learning models further, let’s dig into several types, including Diffusion Models, K-Means Clustering, and Association Rule Learning.
Discussing Diffusion Models
Popular generative image tools like Stable Diffusion and DALL-E 2 are built on Diffusion Models. Below is an AI-generated image inspired by Launchable’s logo, as imagined by DALL-E 2’s diffusion model prompted with “Digital art, pink rocket ship hurtling into space.”


They work by modeling data as a diffusion process, where information is gradually spread across the data space over time. A diffusion equation governs the diffusion process, which describes how the data evolves over time as it diffuses.
By solving the diffusion equation, the algorithm can extract features or patterns from the data that can be used for various tasks, such as classification or denoising. The diffusion model is particularly useful for data that is noisy, incomplete, or high-dimensional, as it can smooth out the noise and highlight the most important features.
Covering K-Means Clustering
K-Means Clustering is a type of machine learning algorithm used for unsupervised learning tasks, such as clustering and grouping similar data points together. K-Means Clustering aims to partition a set of data points into k clusters, where k is a user-specified parameter.
The algorithm works by first selecting k random points as the initial centroids for the clusters. Each data point is then assigned to the nearest centroid based on the Euclidean distance between the data point and the centroids. The algorithm then recalculates the centroids of each cluster based on the mean of the data points assigned to that cluster. This process is repeated iteratively until the cluster assignments, and centroids converge and stabilize.
K-Means Clustering can be used to identify groups or clusters of similar data points based on their features. It can be applied to a wide range of applications, such as customer segmentation, image segmentation, and anomaly detection, among others.
Here’s an example visualization of K-Means Clusters segmenting the pictures from the iris dataset by the different floral features shown in them:

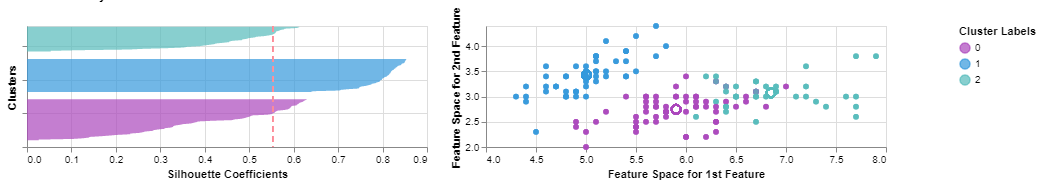
A machine learning practitioner might keep experimenting with their model until they find the best fit for their dataset.
All About Association Rule Learning
Association Rule Learning is a type of unsupervised machine learning algorithm used for discovering interesting relationships between variables in large datasets. It is often used in market basket analysis, where the goal is to identify patterns in consumer purchasing behavior.
The algorithm identifies frequent itemsets, which are sets of items that occur together in transactions above a certain minimum support threshold. It then generates association rules, which describe the relationships between these itemsets based on their co-occurrence patterns.
Each association rule consists of an antecedent (the set of items that precede the consequent in the transaction) and a consequent (the item that follows the antecedent in the transaction), along with a confidence score and support value. The confidence score indicates the strength of the relationship between the antecedent and the consequent, while the support value indicates the frequency with which the antecedent and consequent occur together.
Association Rule Learning can be useful in a variety of applications, such as recommending products to customers based on their past purchases, identifying the most effective marketing strategies for different customer segments, and detecting anomalies in network traffic or system logs. However, it can also be computationally intensive and require careful tuning of the minimum support and confidence thresholds to avoid generating too many or too few rules.
Weighing the Upsides and Downsides of Machine Learning Models
As a powerful tool for automated decision-making, machine learning models can help reduce human error and increase the accuracy of decisions. Understand the upsides to machine learning models and how they could optimize your processes and decision-making.
Speed and Efficiency: Machine learning algorithms can process and analyze large amounts of data much faster than humans, making it possible to make real-time or near-real-time decisions. This can be especially important in applications requiring quick decisions, such as fraud detection or autonomous driving.
Accuracy and Consistency: Machine learning algorithms can make decisions with a high accuracy and consistency since they are based on statistical models trained on large amounts of data. This helps reduce errors and biases that may occur with human decision-making.
Adaptability: Machine learning algorithms can adapt to changing conditions and data inputs, making them useful when the decision-making environment is dynamic or complex. For example, a manufacturing plant's algorithm for predictive maintenance can continuously learn from new data and adjust its predictions accordingly.
Scalability: Machine learning algorithms can be easily scaled up or down depending on the data size and the complexity of the problem being solved. This makes it possible to apply machine learning to a wide range of applications, from small-scale data analysis to large-scale industrial automation.
While the upsides of machine learning models prove their significant business impact, the downsides can interfere with their effectiveness and accuracy. Know the signs so you can avoid the downside of machine learning and get the most out of the intelligence.

Data quality issues: Machine learning algorithms require large amounts of high-quality data to train and make accurate predictions. If the data is complete, accurate, and biased, it can lead to correct or reliable results. Additionally, data may contain outliers, noise, or other anomalies that can negatively impact the model's accuracy.
Overfitting: Machine learning models can sometimes be too complex and overfit the training data, meaning they perform well on the training data but must generalize to new data. This can be caused by a too complex model or training on too small a dataset.
Interpretability: Machine learning models can be challenging to interpret and understand, mainly if they are based on complex algorithms such as deep learning. This can make it tough to explain the reasoning behind a particular decision or identify and correct model errors.
Not applicable to all problems: Machine learning is not a universal solution and may only be appropriate for some problems. For example, issues that require subjective judgment or human intuition may need to be better suited for machine learning approaches.
Under the Hood of Launchable’s Machine Learning Model
Launchable uses machine learning to speed up software test suites for faster delivery. Predictive Test Selection uses code change logs and test execution history as inputs and applies machine learning to figure out which tests are more likely to fail for a given pull request. The target data of the training is binary, as in it is pass/fail.
Launchable’s Predictive Test Selection is a supervised machine learning model that uses a Decision Tree algorithm to train and execute intelligent test case selection quickly. Here’s the data that we use to train and fine-tune the machine learning models and how the process works:
We analyze your tests. We use your git commit metadata to interpret your test suites through the Launchable CLI. This works with your existing pipeline and is the data that we’ll feed into your customized ML model.
We train your model. Using a machine learning algorithm, Launchable predicts the likelihood of failure for each test. Model training takes two weeks.
We subset your tests. Launchable makes the most significant impact when we can reorder your tests to run a subset earlier in your dev cycle. We call this use case “Shift Left.”
You ship faster without risk. Many software projects can run 20% of your total tests and achieve 90% confidence that you’ve found a failure, letting you launch fearlessly.
Machine learning models have infinite potential to enhance processes and garner further intelligence across finance and manufacturing, marketing and healthcare, and especially software development. If you’re ready to launch your data-driven software test selection and cut test suite runtimes times, Launchable’s machine learning model allows you to ship 5x faster without additional risk.


